Show a side-by-side git diff on any commit in tig using Meld

Side-by-side diffs are more readable to me than in-line diffs. Long time ago, I started using Meld to display them when working with git. But I always needed to manually specify branch or commit names. This week I finally spent some time and found a way to invoke Meld directly from tig, so that I can see the diff side-by-side while browsing a commit history in tig (for example, when I want to review a proposed branch containing 10 new commits, and I want to inspect each of them individually). Here’s a short howto.

First, let’s configure Meld as your git difftool:

git config --global diff.tool meld

You can now see a diff between two branches/commits with:

git difftool -d branch1 branch2

That’s a lot of typing, though, so let’s create a handy alias:

git config --global alias.dt 'difftool -d'

And now you can use:

git dt branch1 branch2

And now, let’s integrate this into tig. Edit ~/.config/tig/config and add this snippet:

# use difftool to compare a commit in main/diff view with its parent
# https://github.com/jonas/tig/issues/219#issuecomment-406817763
bind main w !git difftool -d %(commit)^!
bind diff w !git difftool -d %(commit)^!

Notice I chose the “w” key as a shortcut key, because it’s unassigned by default. You can choose a different shortcut of course, see man tigrc.

Now anytime you want to see a side-by-side diff on any commit displayed in tig:

You simply press w and you’ll see the diff between the commit and its parent show up in Meld:

This improved my life a lot, perhaps it helped you as well 🙂 Cheers.

Taskotron is EOL (end of life) today

As previously announced, Taskotron (project page) will be shut down today. See the announcement and its discussion for more details and some background info.

As a result, certain tests (beginning with “dist.“) will no longer appear for new updates in Bodhi (in Automated Tests tab). Some of those tests (and even new ones) will hopefully come back in the future with the help of Fedora CI.

Thank you to everyone who contributed to Taskotron in the past or found our test reports helpful.

taskotron

Automatically shrink your VM disk images when you delete files (Fedora 32 update)

I’ve already written about this in 2017, but things got simpler since then. Time for an update!

If you use virtual machines, your disk images just grow and grow, but never shrink – deleted files inside a VM never free up the space on the host. But you can configure the VM to handle TRIM (discard) commands, and then your disk images will reflect deleted files and shrink as well. Here’s how (with Fedora 32 using qemu 4.2 and virt-manager 2.2).

Adjust VM configuration

  1. When creating a new VM, use qcow2 disk images (that’s the default), not raw.
  2. Your new VM should have VirtIO disks (that’s the default).
  3. In virt-manager in VM configuration, select your VirtIO disk, go to Advanced -> Performance, and set Discard mode: unmap.
    virt-manager-unmap

Test it

Now boot your VM and try to issue a TRIM command:

$ sudo fstrim -av
/boot: 908.5 MiB (952631296 bytes) trimmed on /dev/vda1
/: 6.8 GiB (7240171520 bytes) trimmed on /dev/mapper/fedora-root

You should see some output printed, even if it’s just 0 bytes trimmed, not an error.

Let’s see if the disk image actually shrinks. You need to list its size using du (or ls -s) to see the disk allocated size, not the apparent file size (because the disk image is sparse):

$ du -h discardtest.qcow2 
1.4G discardtest.qcow2

Now create a file inside the VM:

$ dd if=/dev/urandom of=file bs=1M count=500

We created a 500 MB file inside the VM and the disk image grew accordingly (give it a few seconds):

$ du -h discardtest.qcow2
1.9G discardtest.qcow2

Now, remove the file inside the VM and issue a TRIM:

$ rm file -f
$ sudo fstrim -av

And the disk image size should shrink back (give it a few seconds):

$ du -h discardtest.qcow2
1.4G discardtest.qcow2

If you configure your system to send TRIM in real-time (see below), it should shrink right after rm and no fstrim should be needed.

Issue TRIM automatically

With Fedora 32, fstrim.timer is automatically enabled and will trim your system once per week. You can reconfigure it to run more frequently, if you want. You can check the timer using:

$ sudo systemctl list-timers

If you want a real-time TRIM, edit /etc/fstab in the VM and add a discard mount option to the filesystem in question, like this:

UUID=6d368798-f4c2-44f9-8334-6be3c64cc449 / ext4 defaults,discard 1 1

This has some performance impact (they say), but the disk image will shrink right after a file is deleted. (Note: XFS as a root filesystem doesn’t issue TRIM commands without additional tweaking, read more here).

New Fedora package: ntfs-3g-system-compression

If you have a Windows 10 installation, you might not be able to read all files on its NTFS partition. Under certain conditions, Microsoft compresses system files with new compression algorithms which the ntfs-3g driver can’t currently read. Files are displayed with question marks when listed using ls, and you’ll see Input/output error or unsupported reparse point when trying to access these files. Here’s an example:

$ ls -l Windows
...
drwxrwxrwx 1 kparal kparal        0 Sep 15 09:33  ModemLogs
-????????? ? ?      ?             ?            ?  notepad.exe
drwxrwxrwx 1 kparal kparal        0 Dec 14 21:57  OCR
drwxrwxrwx 1 kparal kparal        0 Sep 15 09:33 'Offline Web Pages'
drwxrwxrwx 1 kparal kparal    16384 Dec 14 14:17  Panther
drwxrwxrwx 1 kparal kparal        0 Sep 15 09:33  Performance
-rwxrwxrwx 1 kparal kparal   984966 Feb 13 23:15  PFRO.log
drwxrwxrwx 1 kparal kparal        0 Sep 15 09:33  PLA
drwxrwxrwx 1 kparal kparal    49152 Dec 14 21:59  PolicyDefinitions
drwxrwxrwx 1 kparal kparal   163840 Feb 14 22:41  Prefetch
drwxrwxrwx 1 kparal kparal     4096 Dec 14 14:15  PrintDialog
-????????? ? ?      ?             ?            ?  Professional.xml
drwxrwxrwx 1 kparal kparal     4096 Sep 15 09:33  Provisioning
-????????? ? ?      ?             ?            ?  regedit.exe
drwxrwxrwx 1 kparal kparal        0 Dec 14 22:09  Registration
drwxrwxrwx 1 kparal kparal        0 Sep 15 11:11  RemotePackages
...

$ ls -l Windows/notepad.exe
ls: cannot access 'Windows/notepad.exe': Input/output error

$ cp Windows/notepad.exe .
cp: cannot stat 'Windows/notepad.exe': Input/output error

$ stat Windows/notepad.exe
File: Windows/notepad.exe -> unsupported reparse point
Size: 25            Blocks: 0          IO Block: 4096   symbolic link
Device: 803h/2051d    Inode: 247077      Links: 3
Access: (0777/lrwxrwxrwx)  Uid: ( 1000/  kparal)   Gid: ( 1000/  kparal)
Access: 2019-02-14 22:40:13.270993900 +0100
Modify: 2018-09-15 09:28:56.687095900 +0200
Change: 2018-12-14 21:52:10.685553700 +0100
Birth: -

Fortunately, there’s a ntfs-3g-system-compression plugin that allows you to read those files:

$ ls -l Windows/notepad.exe 
-r-xr-xr-x 3 kparal kparal 254464 Sep 15 09:28 Windows/notepad.exe

The new package is now proposed as an update in Bodhi, but in a week or so you should be able to install it with a simple:

$ sudo dnf install ntfs-3g-system-compression

Enjoy.

Automatically shrink your VM disk images when you delete files

Update: This got significantly simpler with newer qemu and virt-manager, read an updated post.

If you use VMs a lot, you know that with the most popular qcow2 disk format, the disk image starts small, but grows with every filesystem change happening inside the VM. Deleting files inside the VM doesn’t shrink it. Of course that wastes a lot of disk space on your host – the VMs often contain gigabytes of freed space inside the VM, but not on the host. Shrinking the VM images is possible, but tedious and slow. Well, recently I learned that’s actually not true anymore. You can use the TRIM command, used to signalize to SSD drives that some space can be freed, to do the same in virtualization stack – signalize from VM to host that some space can be freed, and the disk image shrunk. How to do that? As usual, this is a shameless copy of instructions found elsewhere on the Internets. The instructions assume you’re using virt-manager or libvirt directly.

First, you need to using qcow2 images, not raw images (you can configure this when adding new disks to your VM).

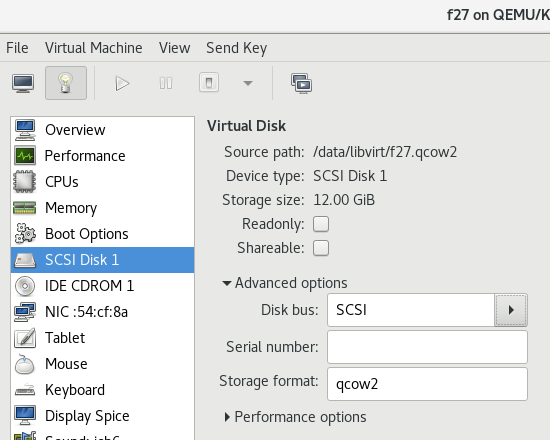
Second, you need to set your disk bus to SCSI (not VirtIO, which is the default).

disk-scsi

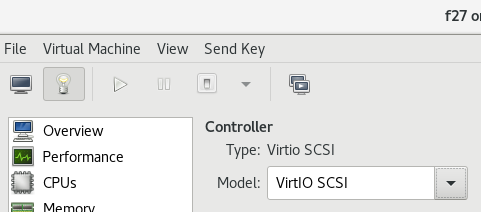
Third, you need to set your SCSI Controller to VirtIO SCSI (not hypervisor default).

controller-scsi

Fourth, you need to edit your VM configuration file using virsh edit vmname and adjust your hard drive’s driver line to include discard='unmap', e.g. like this:

<disk type='file' device='disk'>
 <driver name='qemu' type='qcow2' discard='unmap'/>

And that’s it. Now you boot your VM and try to issue:

$ sudo fstrim -av
/boot: 319.8 MiB (335329280 bytes) trimmed
/: 101.5 GiB (108928946176 bytes) trimmed

You should see some output printed, even if it’s just 0 bytes trimmed, and not an error.

If you’re using LVM, you’ll also need to edit /etc/lvm/lvm.conf and set:

issue_discards = 1

Then it should work, after a reboot.

Now, if you want trimming to occur automatically in your VM, you have two options (I usually do both):

Enable the fstrim timer that trims the system once a week by default:

$ sudo systemctl enable fstrim.timer

And configure the root filesystem (and any other one you’re interested in) to issue discard command automatically after each file is deleted. Edit /etc/fstab and add a discard mount option, like this:

UUID=6d368798-f4c2-44f9-8334-6be3c64cc449 / ext4 defaults,discard 1 1

And that’s it. Try to create a big file using dd, watch your VM image grow. Then delete the file, watch the image shrink. Awesome. If only we had this by default.

SSH to your VMs without knowing their IP address

This is a shameless copy of this blog post, but I felt like I need to put it here as well, so that I can find it the next time I need it 🙂

libvirt approach

When you run a lot of VMs, especially for testing, every time with a fresh operating system, connecting to them is a pain, because you always need to figure out their IP address first. Turns out that is no longer true. I simply added this snippet to my ~/.ssh/config:

# https://penguindroppings.wordpress.com/2017/09/20/easy-ssh-into-libvirt-vms-and-lxd-containers/
# NOTE: doesn't work with uppercase VM names
Host *.vm
 CheckHostIP no
 Compression no
 UserKnownHostsFile /dev/null
 StrictHostKeyChecking no
 ProxyCommand nc $(virsh domifaddr $(echo %h | sed "s/\.vm//g") | awk -F'[ /]+' '{if (NR>2 && $5) print $5}') %p

and now I can simply execute ssh test.vm for a VM named test and I’m connected! A huge time saver. It doesn’t work with uppercase letters in VM names and I didn’t bother to try to fix that. Also, since I run VMs just for testing purposes, I disabled all ssh security checks (you should not do that for important machines).

avahi approach

There’s also a second approach I used for persistent VMs (those that survive for longer than a single install&reboot cycle). You can use Avahi to search for a hostname on the .local domain to find the IP address. Fedora has this enabled by default (if you have nss-mdns package installed, I believe, which should be by default). So, in the VM, set a custom hostname, for example f27:

$ sudo hostnamectl set-hostname f27
$ reboot

Now, you can run ssh f27.local and it should connect you to the VM automatically.

UEFI for QEMU now in Fedora repositories

I haven’t seen any announcement, but I noticed Fedora repositories now contain edk2-ovmf package. That is the package that is necessary to emulate UEFI in QEMU/KVM virtual machines. It seems all licensing issues having been finally resolved and now you can easily run UEFI systems in your virtual machines!

I have updated Using_UEFI_with_QEMU wiki page accordingly.

Enjoy.

glxosd and voglperf now available for Fedora in COPR

For all our gaming enthusiasts, I packaged glxosd and voglperf for Fedora and you can find them in my COPR repositories: glxosd COPR and voglperf COPR.

These tools allow you to have FRAPS-like features on Linux, i.e. show an overlay in OpenGL games/apps to display current FPS, and also capture the frame times into a file and plot them to a graph later. So you can now use it with any Linux game and fine-tune its graphics settings to match your preferred performance. Or you can see when your CPU or GPU is overheating. Or you can contribute to Open Game Benchmarks. Or something else.

This is an example of the glxosd overlay in action (don’t worry, its output is configurable):

glxosd-chivalry.png
glxosd overlay

And if you want, you can later plot the performance into such pretty graphs using this awesome glxosd analyser web page:

glxosdGraph-fps.png
fps graph

glxosdGraph-frametimes.png
frame times graph

And this is an example of the voglperf overlay (top left corner):

voglperf-xcom.png
voglperf overlay

And a generated graph:

voglperf-frametimes.png
frame times graph

There are other similar tools which you can use, but I know about any that is generic and has all these features. There is of course the Steam FPS overlay, but you can only use it for Steam games, and it can’t log frame information. There’s also GALLIUM_HUD, but that’s only available for Gallium-enabled drivers (radeon, nouveau) and also can’t log frame information. These two new tools should work with any driver and can be used for any game/app.

You can find installation instructions in the linked COPR repos. I do not intend to move these packages to official Fedora repos, but if somebody is willing to get their hands dirty and work on that, great, please contact me and I’ll try to help.

Enjoy!

Flattr this

GALLIUM_HUD: FRAPS-like FPS overlay for Linux

I have long been looking for a simple way to display the current FPS in games (without direct support in the game), similar to what FRAPS or other tools do in Windows. For Linux, I haven’t had too much luck. There are not many tools for this and usually there are some problems with them – either they are not packaged and complication is difficult, or they don’t work reliably, or they can’t display FPS overlay in the game, just log to a file. But this weekend, I have finally been lucky.

I have stumbled upon an older article from Phoronix: Gallium3D Gets A Heads-Up Display For Information. Gallium3D is a graphics acceleration framework that is currently used by radeon and nouveau drivers. By simply setting an environment variable, you can get a live on-screen overlay displaying lots of useful information:

gallium-fraps

This is pretty amazing and it does exactly what I was looking for. The usage is really simple – to see the available options, just run:

$ GALLIUM_HUD="help" glxgears
Syntax: GALLIUM_HUD=name1[+name2][...][:value1][,nameI...][;nameJ...]

  Names are identifiers of data sources which will be drawn as graphs
  in panes. Multiple graphs can be drawn in the same pane.
  There can be multiple panes placed in rows and columns.

  '+' separates names which will share a pane.
  ':[value]' specifies the initial maximum value of the Y axis
             for the given pane.
  ',' creates a new pane below the last one.
  ';' creates a new pane at the top of the next column.

  Example: GALLIUM_HUD="cpu,fps;primitives-generated"

  Available names:
    fps
    cpu
    cpu0
    cpu1
    cpu2
    cpu3
    samples-passed

In Fedora 20, only basic options like fps and cpu are available. In Fedora Rawhide with newer graphics stack, there are many more options. But I’m fully content with just the basic ones. Now I can run games like this:

$ GALLIUM_HUD="fps,cpu+cpu0+cpu1+cpu2+cpu3:100" mygame

And I have pretty two graphs of FPS and CPU usage. You can run steam the same way, and then see the overlay on each game started from it. And, as a bonus, you can even run totem or vlc (with GL output) like this and see actual FPS of your video rendering 🙂

I’m really excited about this. This is how I imagine a modern operating system to look like – useful features directly integrated into its core and very easily accessible (hell, it can’t get even easier than setting an environment variable!). Thanks Marek Olšák and AMD for implementing this. You really made my day.

The only drawback is that because it’s implemented in Gallium3D, it works only on Gallium3D-enabled drivers, which means opensource AMD and Nvidia drivers. No binary drivers and no Intel drivers can benefit from this. Marek explained that it had been very simple to implement this inside Gallium3D, but it would be very tricky to implement this on a level that would affect all the drivers. So there you have it, the opensource drivers now have a killer feature that proprietary drivers don’t 🙂 Just the Intel situation is unfortunate, maybe they’ll reconsider this some time in the future.

Enjoy.

Flattr this

KVM disk performance: raw vs qcow2 format

Some time ago I compared disk drivers performance in KVM. Today I compared different storage formats – raw and qcow2. Let’s have a look:

Test procedure: Create an empty 10 GB image, attach to VM using VirtIO driver, boot F20 Alpha Live x86_64, measure the time of installation. Repeat installation once again, this time reusing the existing image (instead of creating a new one). Do this for both formats.

Test results:

raw 1st pass          2:36
raw 2nd pass          2:38
qcow2 1st pass        2:36
qcow2 2nd pass        2:44

As you can see, the results are very much the same. It seems it doesn’t matter much which format you use.

But, qcow2 format has some nice additional features, like copy-on-write cloning. If I need to test something very quickly in my existing VM and then revert the changes back, this is the easiest way:

$ cd /var/lib/libvirt/images
$ mv f19.qcow2 f19.qcow2_orig
$ qemu-img create -f qcow2 -b f19.qcow2_orig f19.qcow2
Formatting 'f19.qcow2', fmt=qcow2 size=10737418240 backing_file='f19.qcow2_orig' encryption=off cluster_size=65536 lazy_refcounts=off
$ # Run the VM now and do your tasks
$ mv f19.qcow2_orig f19.qcow2

Enjoy.

Flattr this